ISM CyberRAG
Information Security Manual
Semantic Search Engine

System Performance

RAGAS evaluation metrics across three sprints, measured against 100 benchmark queries.

Sprint Comparison

Each sprint was evaluated on the same set of 100 queries (90 in-scope ISM questions, 10 out-of-scope). Scores are RAGAS metric averages from the final evaluation notebooks.

Metric Sprint 1 Sprint 2 Sprint 3
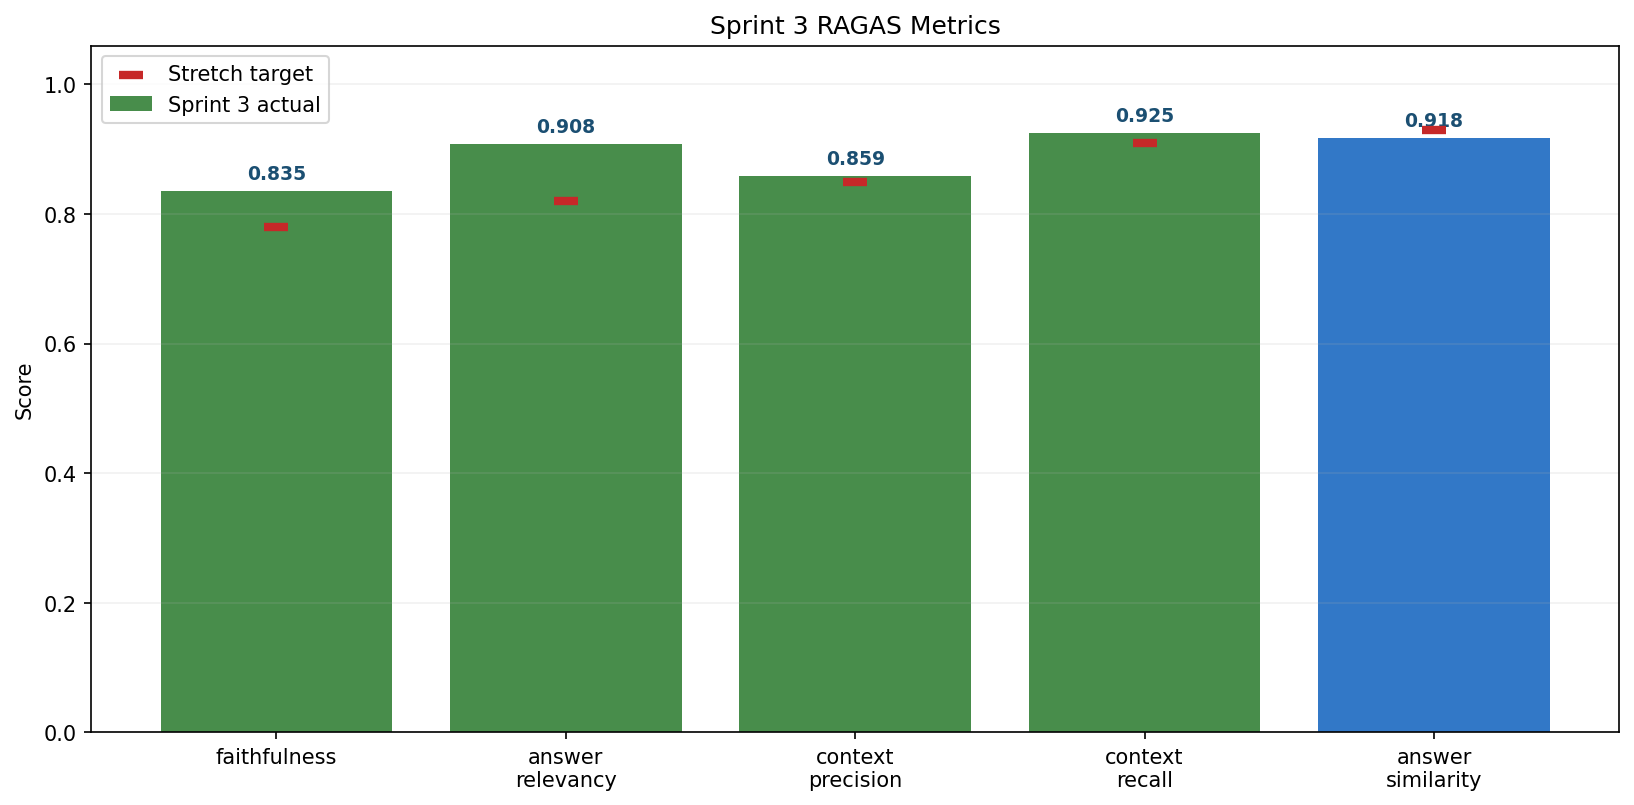
Faithfulness 0.6834 0.7341 0.8351
Answer Relevancy 0.7216 0.7678 0.9078
Context Precision 0.7885 0.8598 0.8590
Context Recall 0.8224 0.8659 0.9249
Answer Similarity N/A 0.9057 0.9179

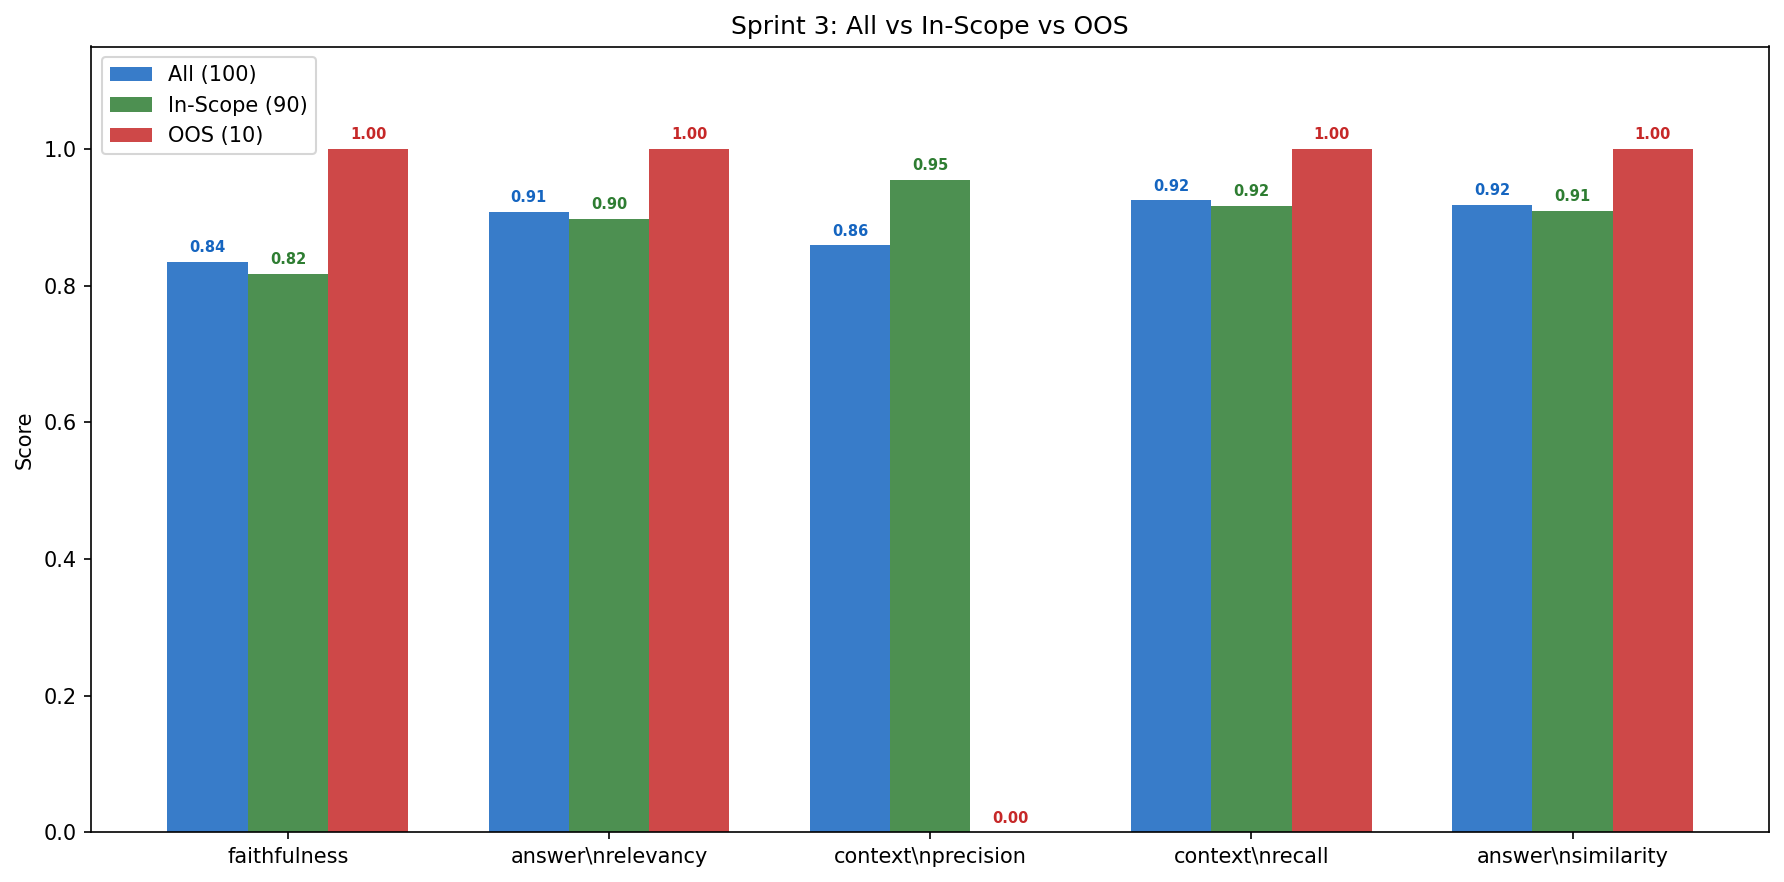
Sprint 1 answer similarity was not measured. Sprint 3 improves answer relevancy, context recall, and answer similarity, while overall context precision stays level with Sprint 2; in-scope context precision is 0.9545.

Answer Relevancy
0.9078
Up 0.1400 vs Sprint 2
Context Recall
0.9249
Improved with multi-query retrieval
In-Scope Precision
0.9545
Retrieval quality on answerable questions
OOS Refusals
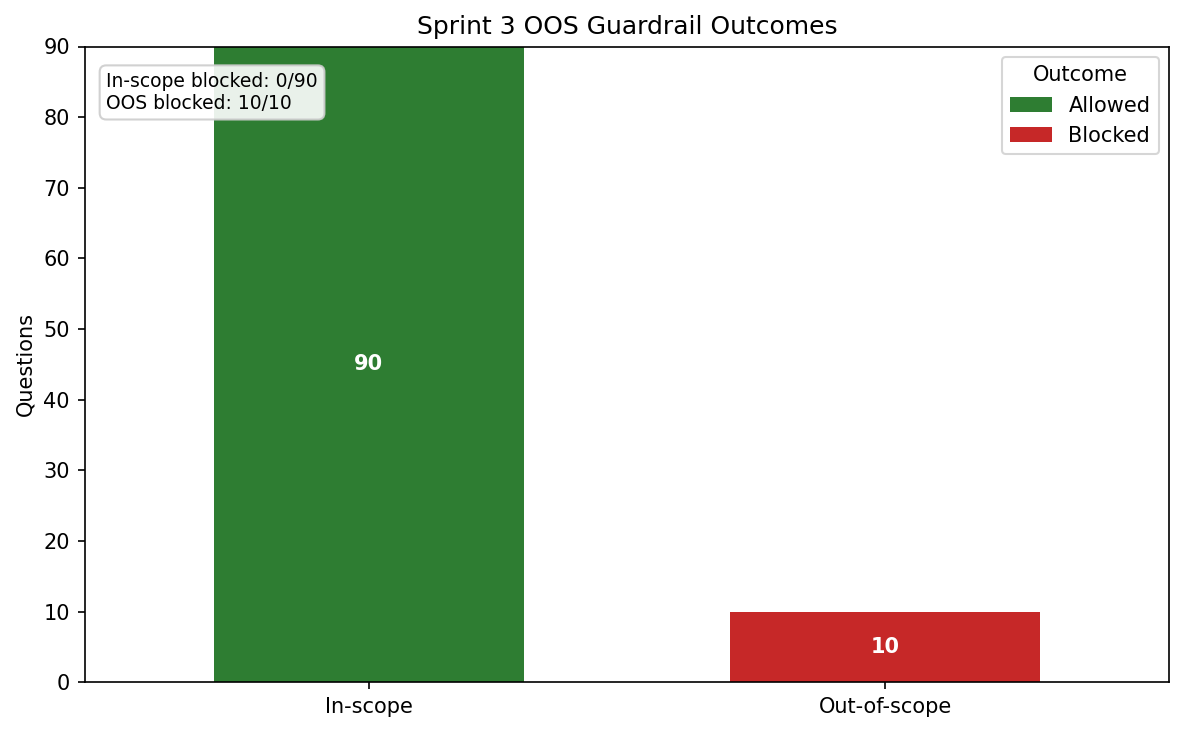
10 / 10
Blocked by guardrail path

What We Built

Each sprint added new components to the RAG pipeline, improving retrieval quality and system reliability.

Sprint 1

Baseline RAG

Fixed-size chunking (1000 char), vector-only search, Llama 3.1 8B via Groq. 900 chunks.

Sprint 2

Improved Pipeline

ISM-aware chunking (643 chunks), hybrid search (BM25 + vector + RRF), cross-encoder reranking, FastAPI web app.

Sprint 3

Production Ready

Multi-query expansion, two-stage OOS guardrail, pipeline explorer, CI/CD, Hugging Face Spaces deployment.

Evaluation Charts

The table gives exact scores. The selected charts below provide visual evidence for sprint progression, guardrail behaviour, category performance, and latency.

Sprint 3 Evidence

Sprint 1 vs Sprint 2 vs Sprint 3 Comparison
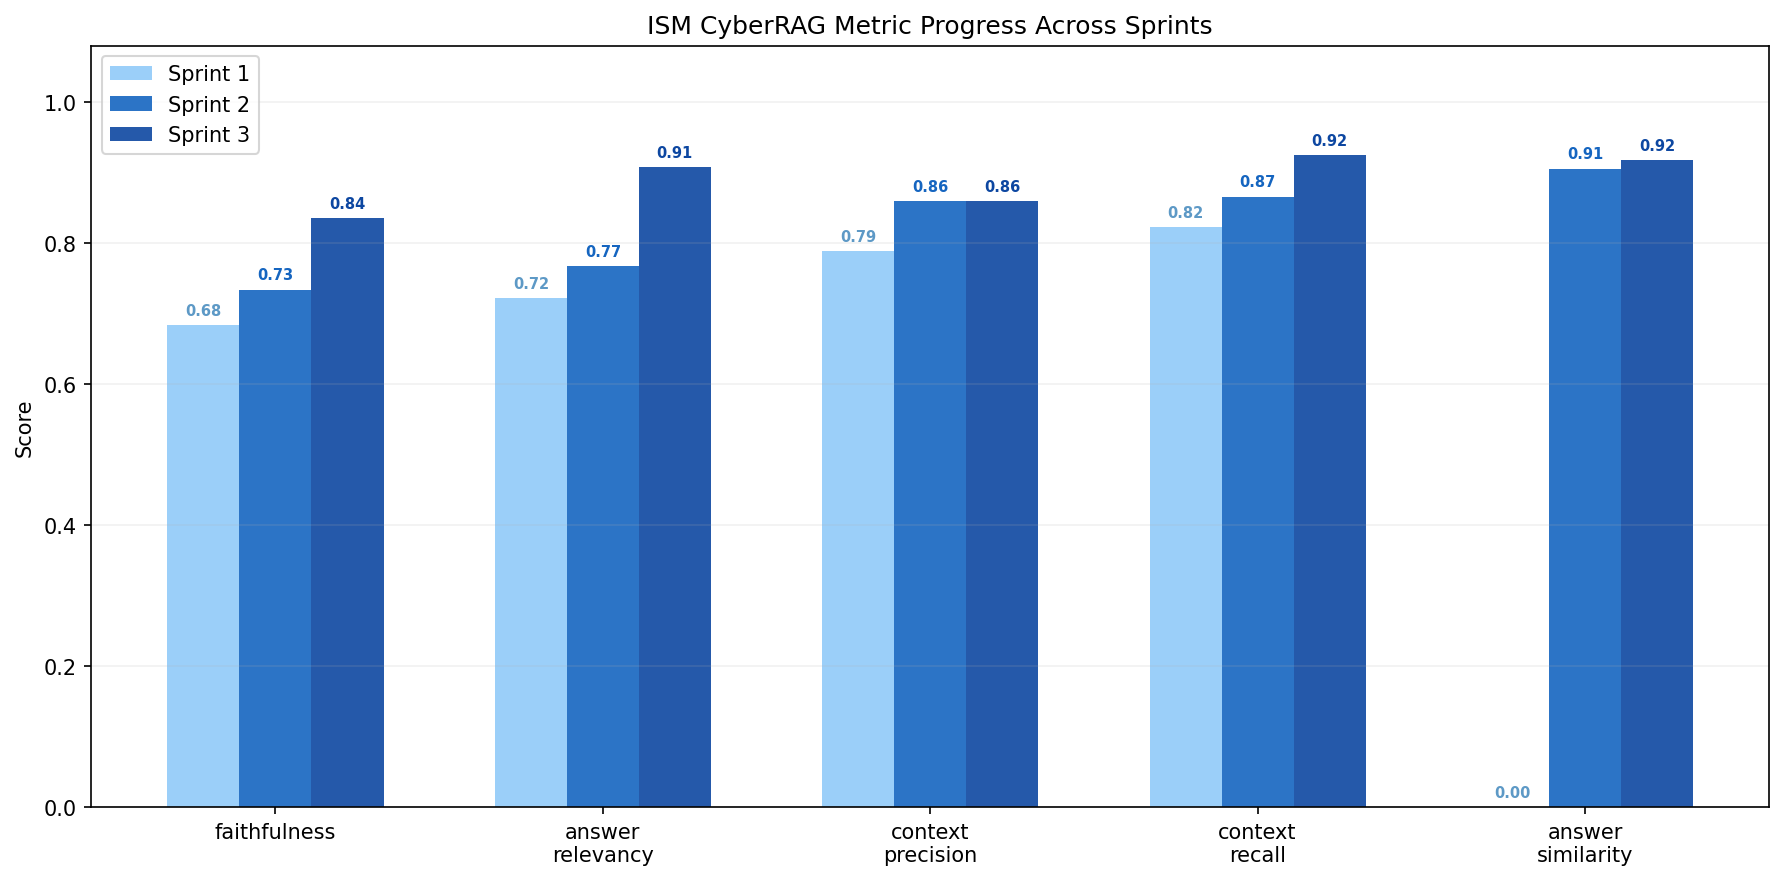
Bar chart comparing RAGAS metric scores across all three sprints
Sprint 3 RAGAS Metrics
Bar chart of Sprint 3 RAGAS metric scores
Guardrail Outcomes
Chart showing Sprint 3 guardrail pass and refusal outcomes
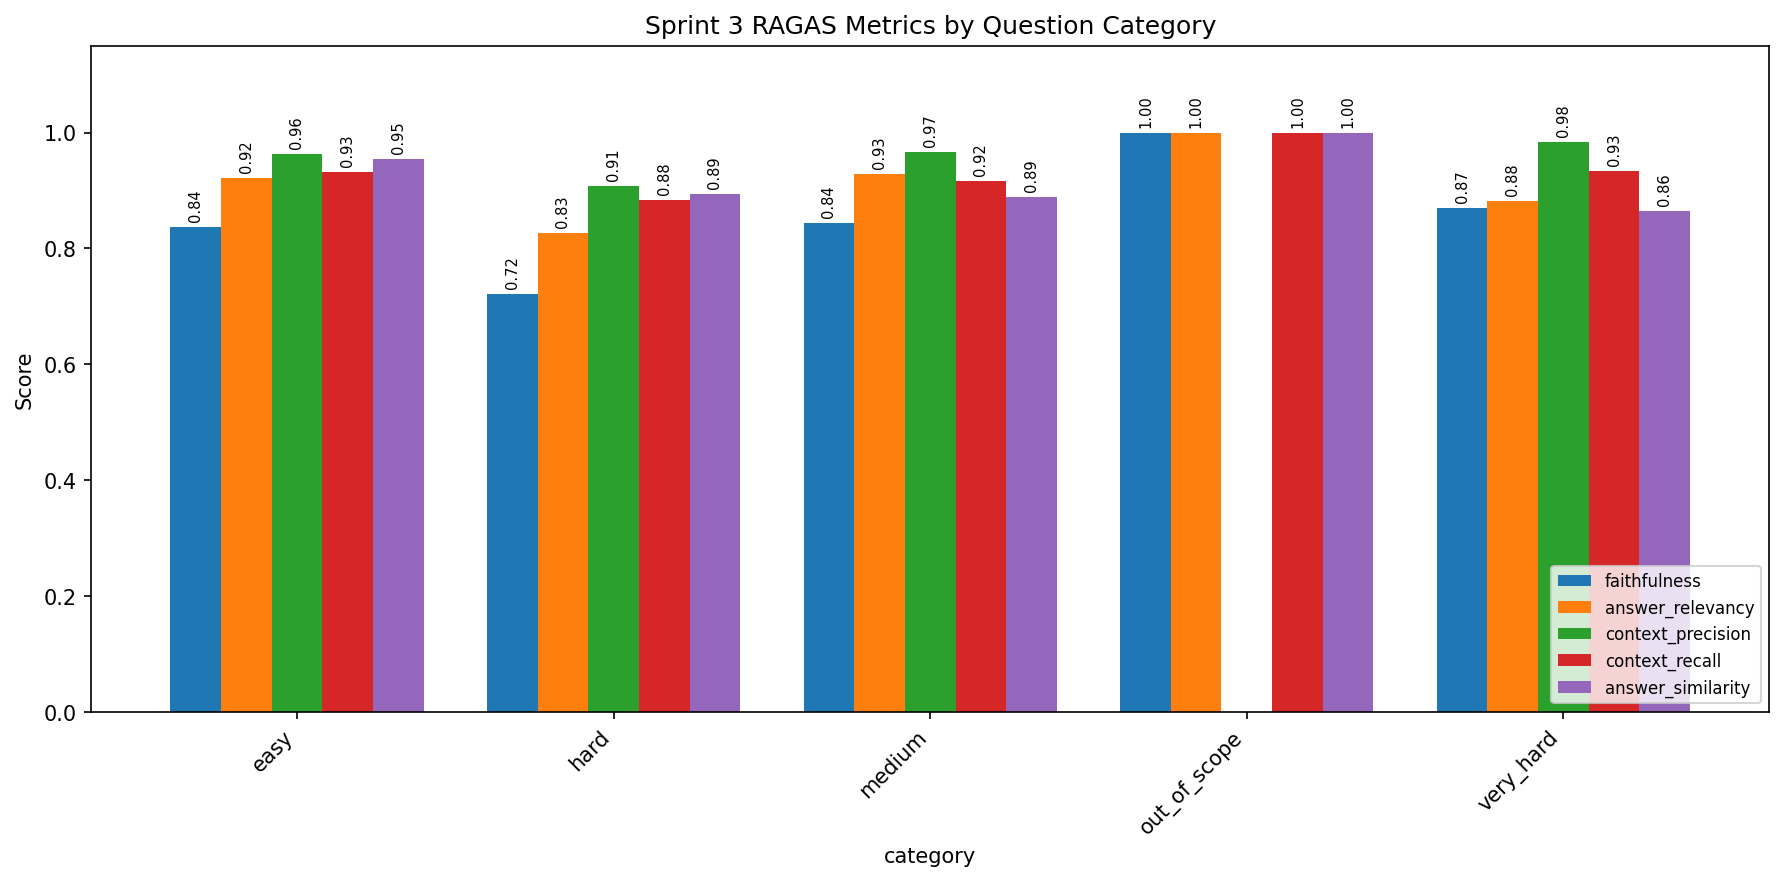
Scores by Difficulty Category
Chart showing Sprint 3 metric scores by difficulty category
In-Scope vs Out-of-Scope
Chart comparing Sprint 3 in-scope and out-of-scope query scores
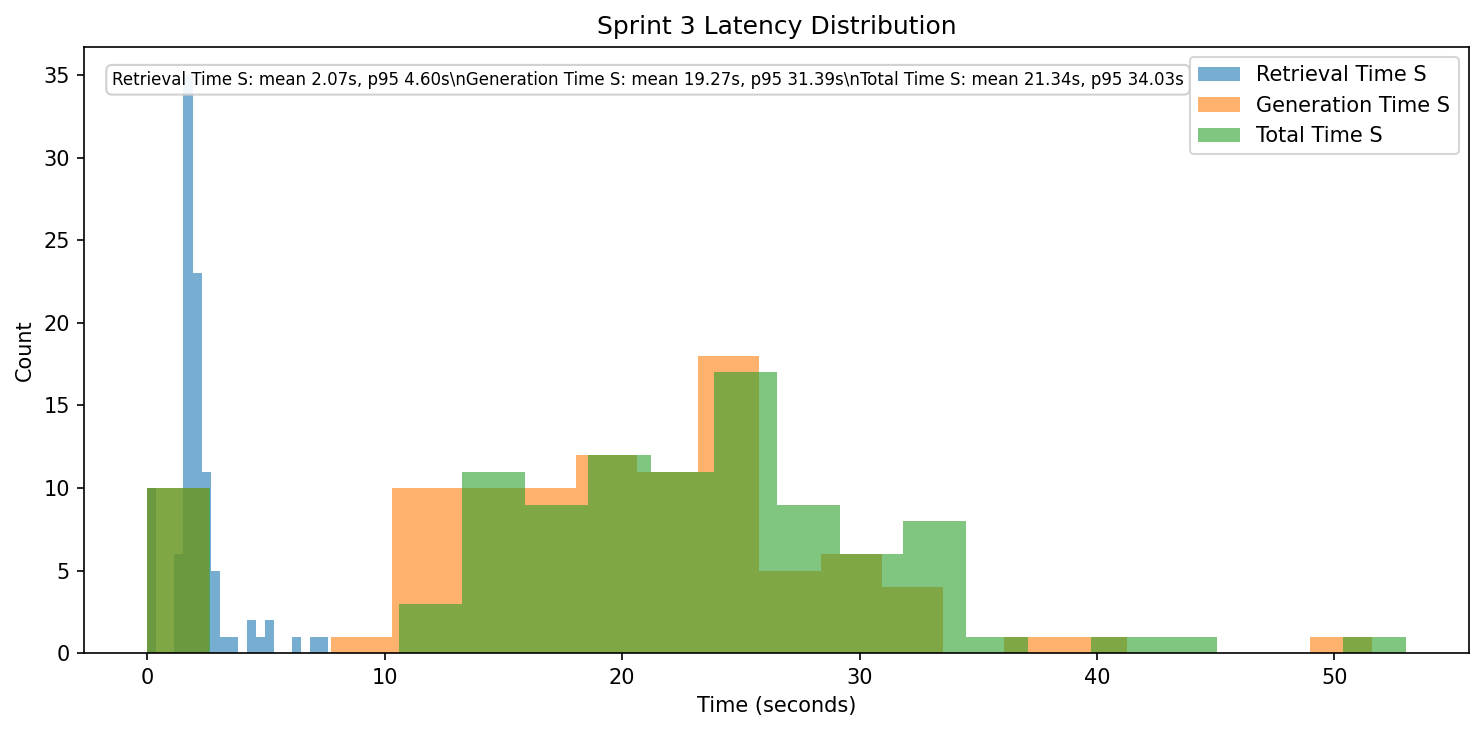
Latency Distribution
Chart showing Sprint 3 query latency distribution
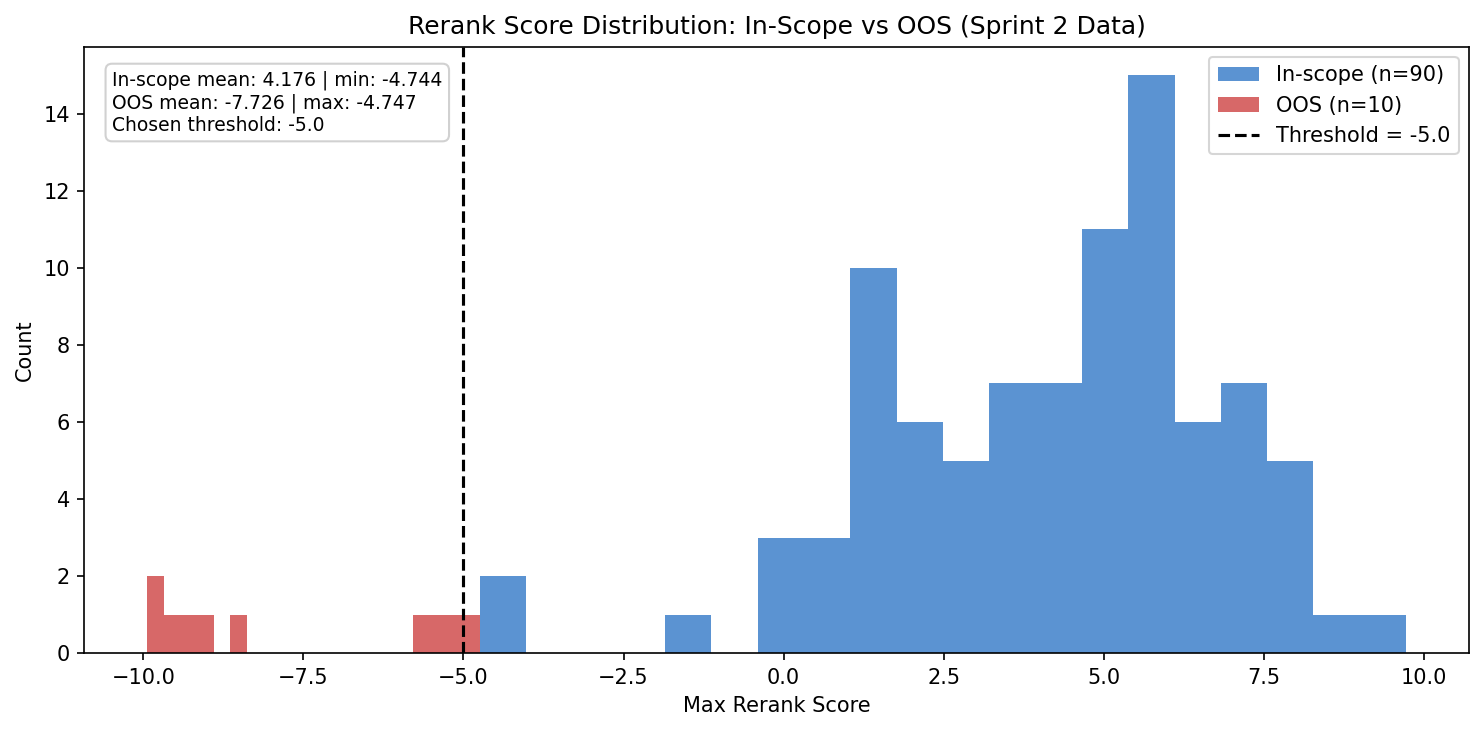
OOS Threshold Calibration
Chart showing Sprint 3 out-of-scope rerank threshold calibration